Egypt Insurance Market 2016
Egypt Insurance Market (Size, Trends)
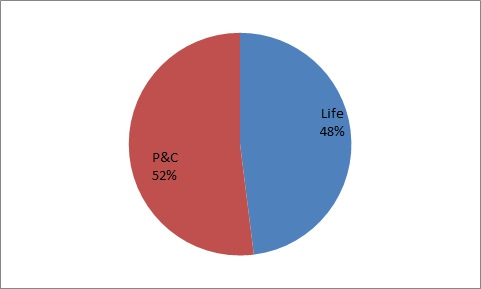
In 2016 Egypt ranked 65 in the world, between Bulgaria and Uruguay, in non-life insurance; in the MENAregion Egypt ranked 7th after Iran, UAE, Saudi Arabia, Qatar, Morocco and Algeria, A breakdown of the total market size for the financial year ending at 2016 is shown below.| GWP in Million | 2011 | 2012 | 2013 | 2014 | 2015 | 2016 |
| Life insurance | 3,999 | 4,483 | 5,367 | 6,154 | 7,339 | 8,324 |
| % of Increase | 12.10% | 19.7% | 14.7% | 19.3% | 13.4% | |
| Non-life insurance | 5,655 | 6,089 | 6,953 | 7,546 | 8,118 | 9,009 |
| % of Increase | 7.67% | 14.19% | 8.53% | 7.58% | 10.98% | |
| Total | 9,654 | 10,572 | 12,320 | 13,700 | 15,457 | 17,333 |
| % of Increase | 9.51% | 16.53% | 11.20% | 12.82% | 12.14% |
Breakdown of Non life by Line of Business
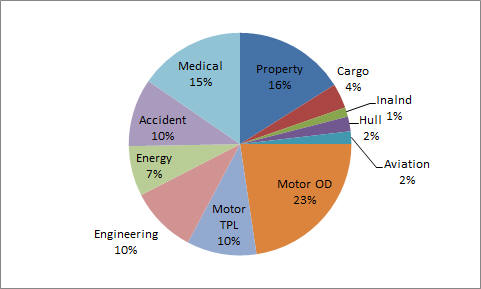
Development of written premium of non life from 2011 till 2016
| 2011 | 2012 | 2013 | 2014 | 2015 | 2016 | % of total | |
| Property | 764,838 | 890,076 | 1,047,589 | 1,215,697 | 1,353,526 | 1,447,700 | 16.07% |
| Cargo | 269,380 | 286,315 | 306,080 | 334,072 | 320,825 | 322,942 | 3.58% |
| Inalnd | 61,335 | 86,350 | 103,696 | 124,146 | 121,860 | 122,961 | 1.36% |
| Hull | 158,312 | 152,663 | 171,081 | 182,346 | 186,174 | 191,954 | 2.13% |
| Aviation | 199,778 | 199,713 | 193,775 | 146,373 | 153,470 | 164,091 | 1.82% |
| Motor OD | 479,451 | 529,557 | 573,305 | 727,230 | 745,021 | 2,042,298 | 22.67% |
| Motor TPL | 546,486 | 626,540 | 815,928 | 735,889 | 774,695 | 912,325 | 10.13% |
| Engineering | 608,691 | 640,544 | 697,023 | 783,305 | 820,650 | 870,728 | 9.66% |
| Energy | 1,442,394 | 1,362,845 | 1,425,157 | 1,571,976 | 1,796,167 | 655,511 | 7.28% |
| Accident | 618,410 | 729,542 | 884,444 | 791,488 | 663,875 | 890,430 | 9.88% |
| Medical | 506,349 | 584,753 | 735,446 | 934,098 | 1,181,715 | 1,388,453 | 15.41% |
| 5,655,424 | 6,088,898 | 6,953,524 | 7,546,620 | 8,117,978 | 9,009,393 | 100.00% |
Key figures of life business in 2016
| GWP | Acquisition | Management | Investement | ||
| 2015 | 2016 | Costs % | Expenses % | Ratio | |
| Misr Life | 2,601 | 2,804 | 57.50% | 13.23% | 35.7% |
| Suez Canal | 278 | 432 | 423.00% | 5.75% | 16.3% |
| Mohandes | 48 | 74 | 75.90% | 21.26% | 29.5% |
| Delta | 157 | 170 | 61.60% | 9.50% | 19.2% |
| Metlife | 1,188 | 1,404 | 171.80% | 7.14% | 17.0% |
| CIL | 915 | 1,095 | 38.50% | 5.08% | 19.1% |
| Allianz Life | 1,295 | 1,362 | 57.99% | 6.51% | 18.9% |
| QNB Ahli | 277 | 318 | 33.06% | 6.38% | 15.2% |
| Chubb Life | 111 | 139 | 33.06% | 24.78% | 58.6% |
| Egyptian Takaful | 342 | 391 | 76.41% | 7.07% | 30.9% |
| Tokyo Marine | 57 | 42 | 89.11% | 1.48% | 1.5% |
| Arobe | 20 | 30 | 50.43% | 31.00% | 61.2% |
| Swiss Lebano | 28 | 54 | 1.73% | 1.17% | 1.2% |
| Misr Emirates Takaful | 0 | 8 | 0.00% | 0.00% | 0.0% |
| Total | 7,317 | 8,323 | 82.91% | 10.03% | 23.2% |
GWP & NWP of Insurance Companies for Non Life Business in 2016
| GWP | Market | Retained | |
| Share | Premium | ||
| Misr Ins. | 4,353,616 | 48.32% | 3,180,749 |
| Suez Canal. | 615,345 | 6.83% | 356,349 |
| Mohandes Ins. | 558,502 | 6.20% | 230,045 |
| Delta Ins. | 536,705 | 5.96% | 259,723 |
| AIG | 350,085 | 3.89% | 127,102 |
| AMIG | 344,400 | 3.82% | 195,355 |
| Egyptian Export Credit Insurance Company | 340,822 | 3.78% | 250,725 |
| Cooperative Ins. Society | 302,350 | 3.36% | 99,475 |
| Chubb | 262,780 | 2.92% | 64,545 |
| Royal | 240,434 | 2.67% | 143,729 |
| Allianz | 221,893 | 2.46% | 137,981 |
| Egyptian Saudi ins. Co | 205,507 | 2.28% | 169,801 |
| Bupa | 117,207 | 1.30% | 44,021 |
| Egyptian Takaful | 115,486 | 1.28% | 80,799 |
| Wethaq | 94,766 | 1.05% | 70,246 |
| Arope | 90,117 | 1.00% | 57,823 |
| Iskan | 86553 | 0.96% | 81,479 |
| Tokyo Marine | 86,408 | 0.96% | 38,593 |
| Orient Egypt | 46,166 | 0.51% | 13,714 |
| AXA | 37,098 | 0.41% | 30269 |
| United | 3,151 | 0.03% | 1,579 |
| total | 9,009,393 | 100.00% | 5,634,102 |